Even Covid-19 Couldn't Keep Phoenix Home Price Gains Down
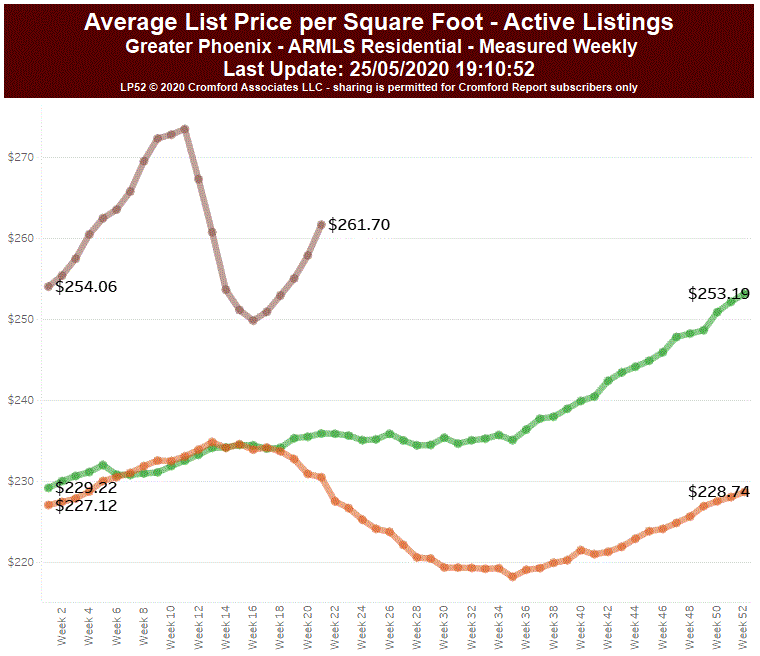
The asking prices for active listings appeared to take a steep dive in March and April, only to recover again in May.

Those who do not inspect real estate data too carefully may jump to the conclusion that this was a buying opportunity that has now gone away. In fact the chart is not dissimilar to the S&P 500 stock price index for the same period.
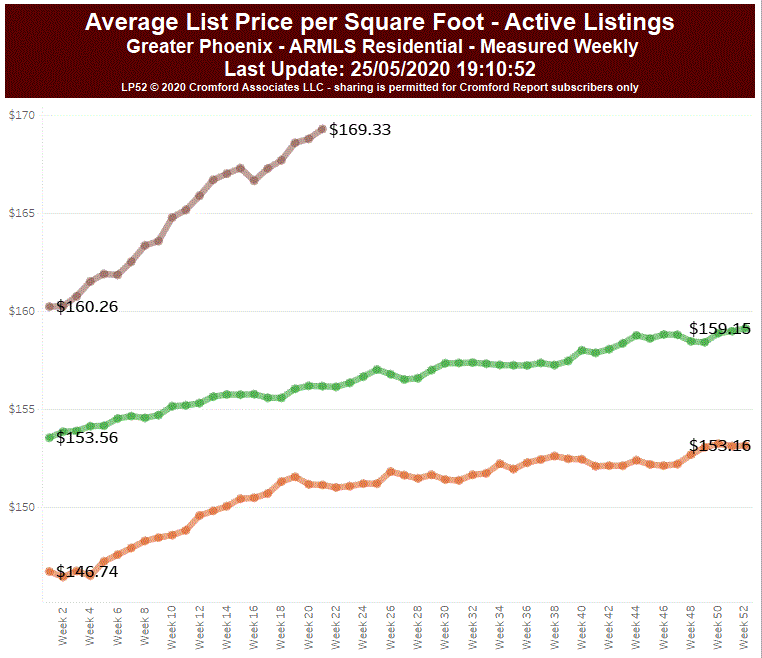
However most of that dip was due to the cancellation of many high-end listings by sellers who did not want people viewing their homes during the pandemic. If we filter the listings to show only those priced under $500,000 we see the following instead:

Of course the $/SF numbers all get lower because we are only looking at homes under $500,000. We can still see a small dip, but it only lasted one week and prices have continued to rise over the last 5 weeks to reach new heights, well above last year.
If this does not look like a pricing crash, there is a good reason for that...it isn't.
Some inexperienced pundits, especially those with lucrative YouTube channels, like to promote the fallacy that home prices will fall when unemployment rises, or that homes prices fall when interest rates rise. They also seem to believe that home prices crash very badly when both of these occur at the same time. This is not necessarily true. It is certainly true that these things reduce demand. But prices do not depend exclusively on demand. Supply is just as important. If supply remains weaker than demand then prices have to stay high in the inevitable negotiation battle between buyers and sellers. Sellers never want prices to go down and they will not cut their prices if they have multiple offers. They only cut prices when they have had no offers for some time and start to feel impatient. Unless they are badly over-priced, this occurs when there are too many homes on the market. When supply is lower than demand, few listings remain without offers for very long, so prices are unable to fall, despite the wishes and prayers of thousands of potential buyers.
We do have more plentiful supply at higher price points and demand is relatively weak above $600,000. This means the average asking price for homes over $500,000 is about the same level as it was in January, after dropping from a high point in March. However the trend is now upwards rather than downwards. You may be able to negotiate a better deal from an impatient seller in locations like Paradise Valley, but we are not seeing general list prices weakening at this point, even for the high-end.
When comparing sale prices in the Phoenix housing market to 20 other metropolitan cities between January and March 2020, Phoenix slipped from 5th to 13th place last month but was over the national average of +0.84%.
Comparing with the previous month's series we see the following changes:
Seattle +2.54%
San Francisco +1.78%
San Diego +1.56%
Boston +1.53%
Chicago +1.46%
Cleveland +1.40%
Tampa +1.32%
Denver +1.30%
Minneapolis +1.26%
Charlotte +1.23%
Washington +1.19%
Los Angeles +1.15%
Phoenix +1.08%
Las Vegas +1.02%
Atlanta +1.00%
Portland +0.71%
Miami +0.67%
Dallas +0.56%
New York +0.20%
Detroit - data not available
When looking at the year over year comparison the national average is 4.35% and Phoenix remained in the top spot and now has a gap of 1.3% over the number 2 city - Seattle.
Below is the year over year comparisons:
Phoenix 8.2%
Seattle 6.9%
Tampa 5.8%
Charlotte 5.8%
Minneapolis 5.3%
San Diego 5.2%
Cleveland 5.0%
Portland 4.9%
Atlanta 4.9%
Boston 4.8%
Los Angeles 4.4%
Las Vegas 4.4%
Washington 3.9%
Denver 3.7%
San Francisco 3.5%
Miami 3.4%
Dallas 2.8%
New York 2.1%
Chicago 1.6%
Detroit - data not available
The above information was taken from the S&P/Case-Shiller® Home Price Indices which measures the residential housing market, tracking changes in the value of the residential real estate market in 20 metropolitan regions across the United States. These indices use the repeat sales pricing technique to measure housing markets. First developed by Karl Case and Robert Shiller, this methodology collects data on single-family home re-sales, capturing re-sold sale prices to form sale pairs. This index family consists of 20 regional indices and two composite indices as aggregates of the regions.
The indices are maintained by an Index Committee, whose members include Standard & Poor's, Fiserv and leading industry experts. It follows a set of published guidelines and policies that provide the transparent methodologies used to maintain the index.
The S&P/Case-Shiller Home Price Indices are calculated monthly and published with a two month lag. New index levels are released by Standard & Poors and Fiserv at 9am Eastern Standard Time on the last Tuesday of every month.


