
Monday Morning Real Estate Mojo


July, 27 2026
Edition #199
Mojo defined
1. A term used for self-confidence, self-assuredness.
2. The basis for belief in ones self in a situation.
3. Efficacy to bolster confidence.
4. Ability to bounce back.
There has been so much misinformation about the real estate market in the national media lately...our goal is always to provide our clients with accurate, real time market data.
Phoenix Housing Market Holds Steady Despite Mixed Signals
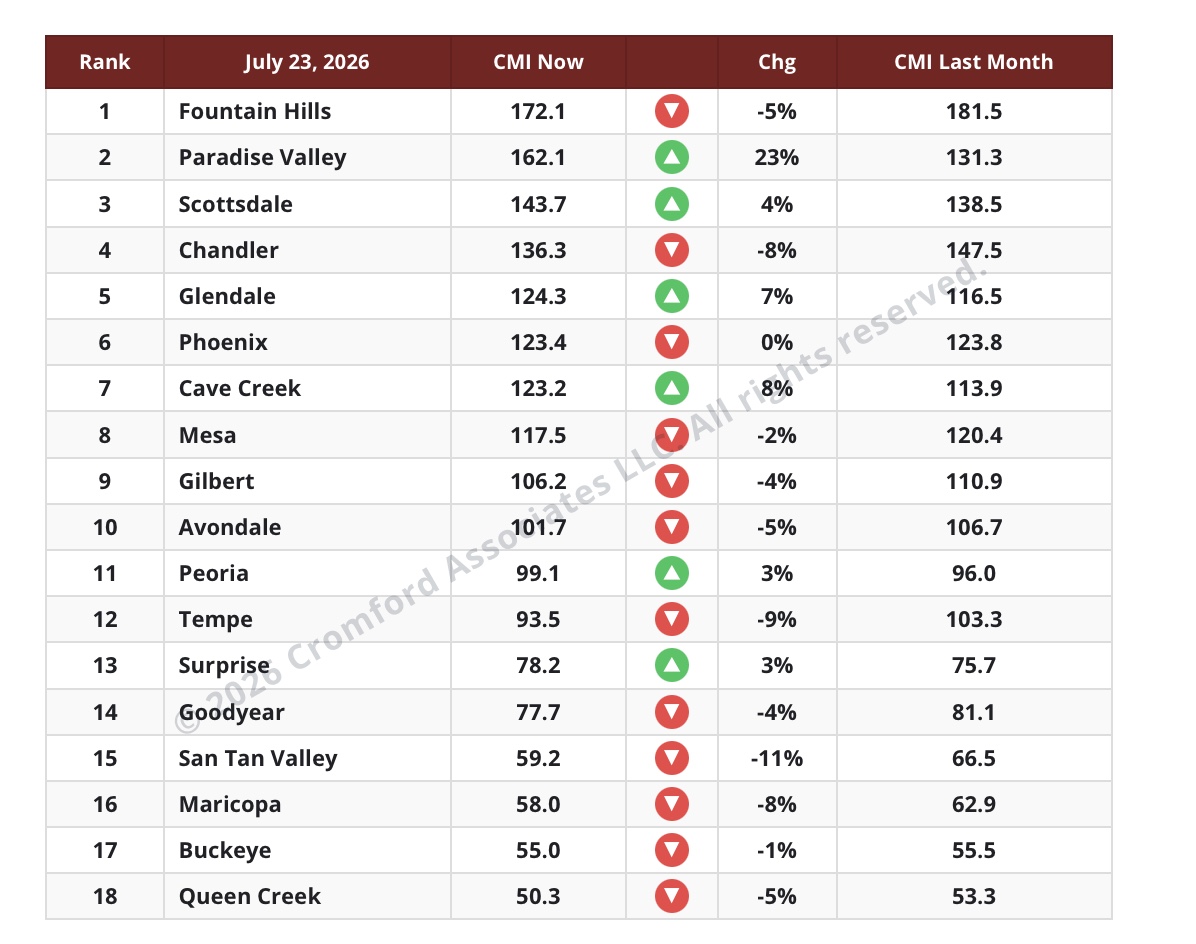
The Greater Phoenix housing market continues to hold steady, with only subtle changes from month to month. The average Cromford Market Index (CMI)* slipped 0.8% from last month, indicating a market that remains relatively balanced overall. While inventory has leveled off and is drifting slightly lower, buyer demand remains soft—but importantly, it has stopped weakening. The result is a market that continues to move sideways rather than clearly favoring either buyers or sellers.
While the overall market has remained stable, local conditions continue to vary significantly by community. Twelve cities are currently trending in a direction that favors buyers, one more than last week, while six cities are showing improving conditions for sellers. Paradise Valley continues to lead the way for sellers with an impressive 23% increase in CMI, followed by Cave Creek (+8%) and Glendale (+7%). On the buyer-friendly side, the Southeast Valley remains the softest area of the metro market, with San Tan Valley (-11%), Tempe (-8%), Chandler (-8%), and Maricopa (-8%) experiencing the largest shifts toward buyers.
Overall, market conditions remain remarkably consistent across the Valley, with eight cities currently classified as seller's markets, four balanced markets, and six buyer's markets. For both buyers and sellers, success continues to depend less on the overall headlines and more on understanding the conditions within the specific neighborhood or community where they are buying or selling.
*Cromford Market Index™ (CMI) is a value that provides a short term forecast for the balance of the market. It is derived from the trends in pending, active and sold listings compared with historical data over the previous four years. Values below 100 indicate a buyer's market, while values above 100 indicate a seller's market. A value of 100 indicates a balanced market.
Looking at the annual median sales price across Greater Phoenix, home values have hovered around $450,000 for quite some time. On July 18, the median reached a new high of $454,000, suggesting prices continue to inch higher. Of course, these numbers don't account for the declining purchasing power of the U.S. dollar. Sometimes it's better not to dwell too much on inflation—but it's worth remembering that not every increase in price reflects the same increase in real value.
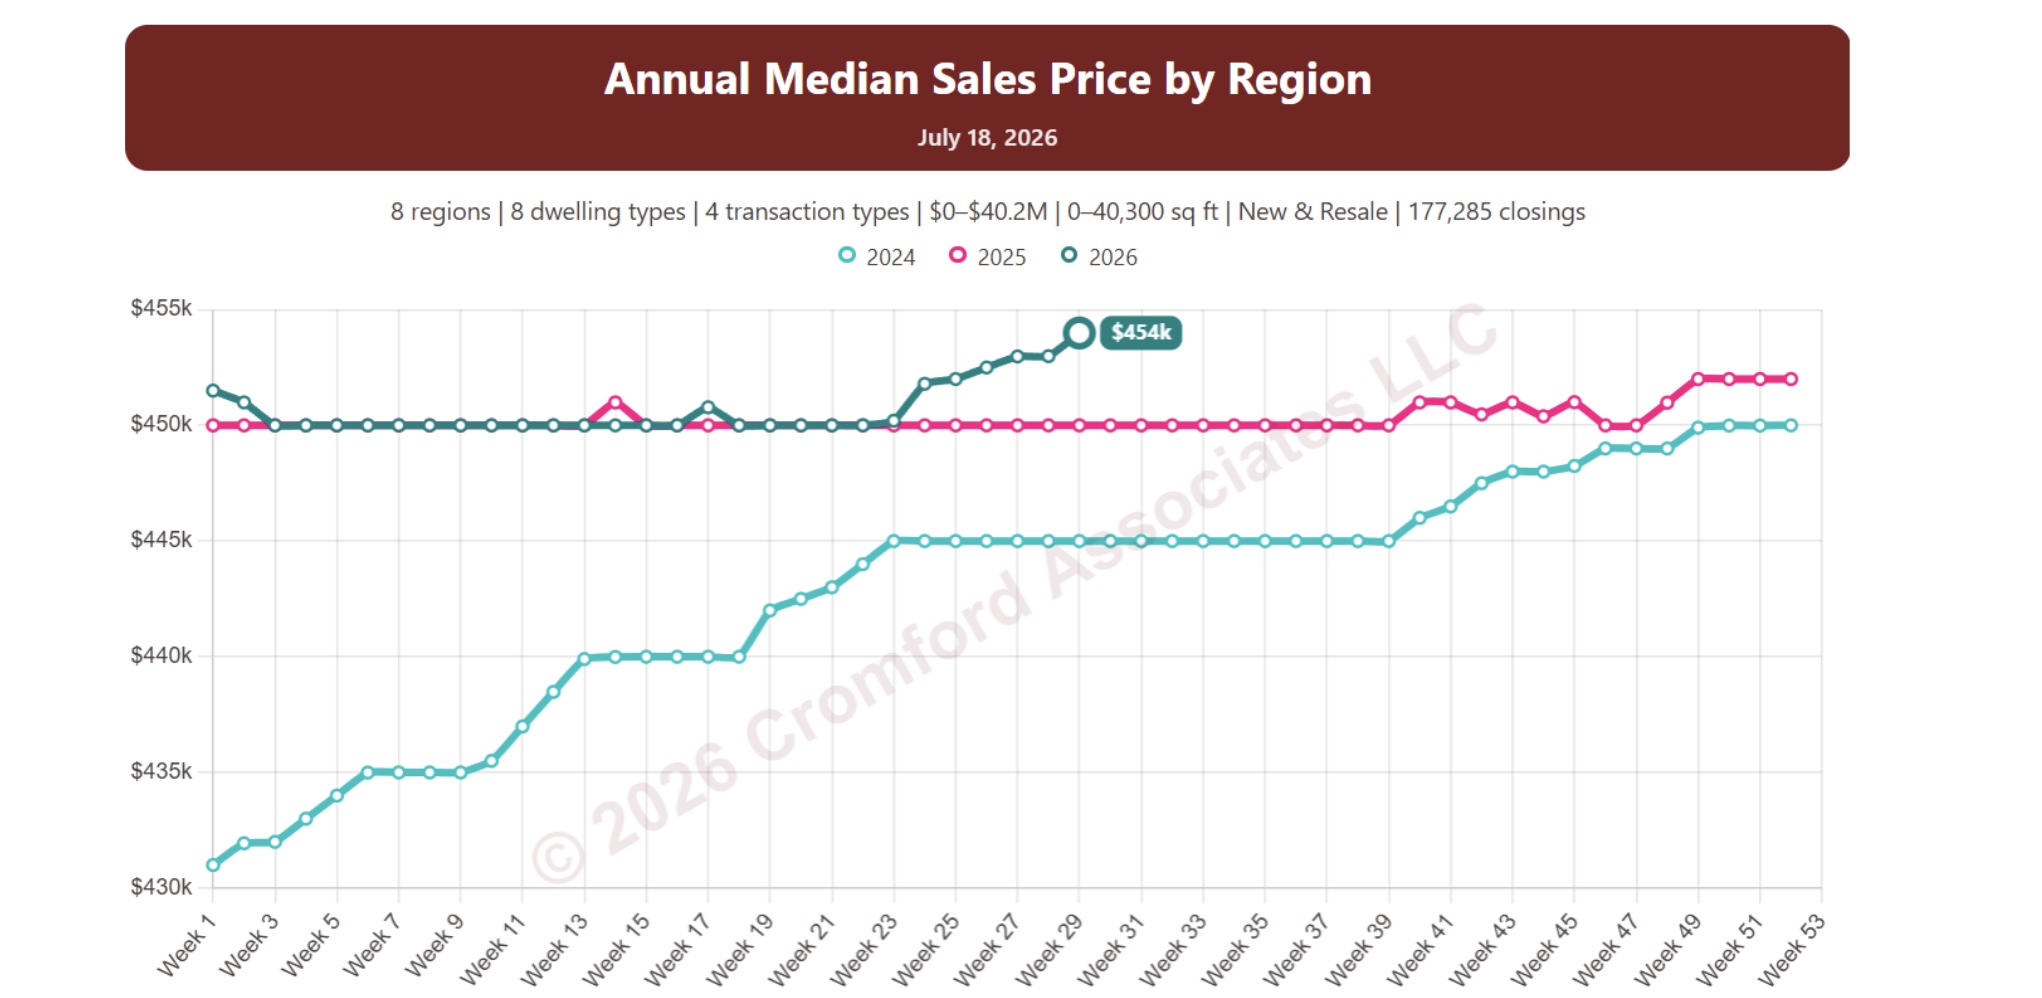
To provide a clearer picture of real home value appreciation, the chart below adjusts nominal prices for inflation using the Phoenix Consumer Price Index, with June 2026 as the baseline.
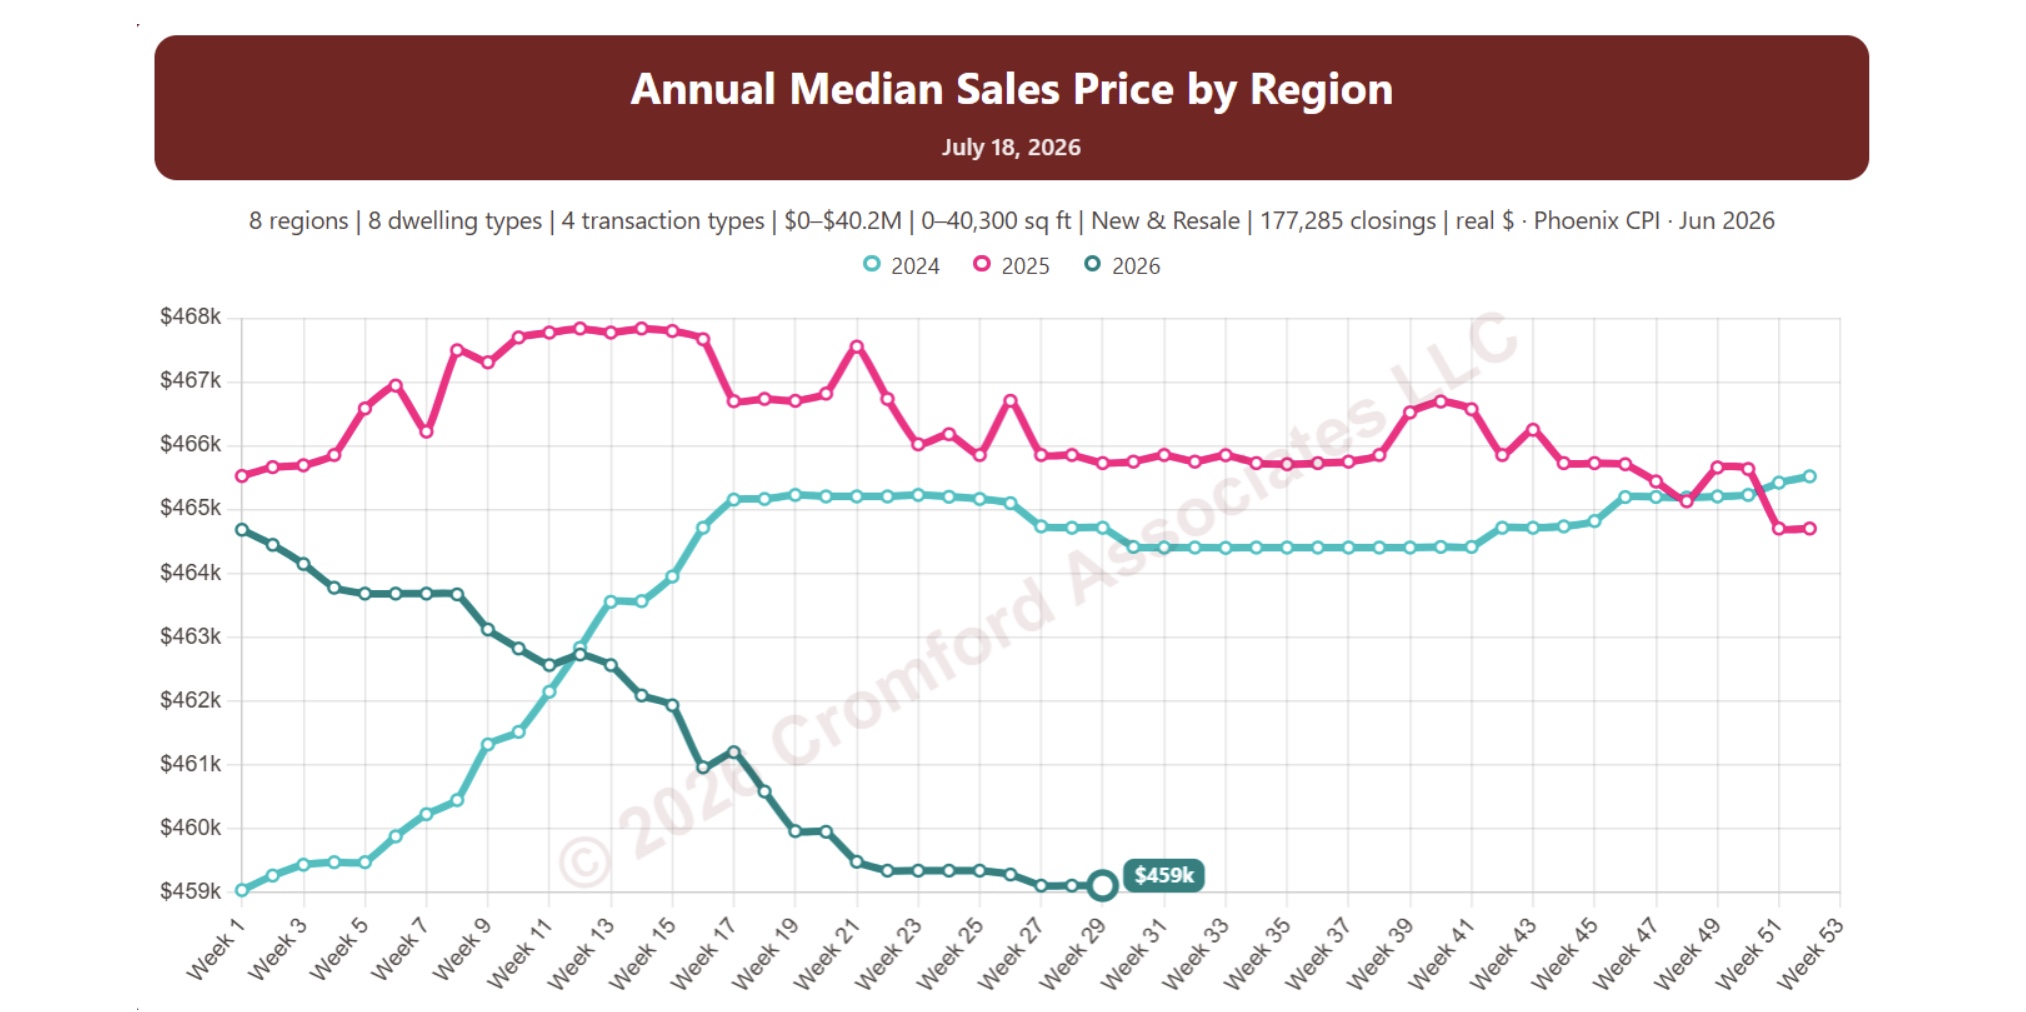
This provides a more accurate perspective on today's market. After adjusting for inflation, the typical home across Greater Phoenix is actually less expensive than it was at any point since the beginning of 2024. Keep in mind, however, that this chart combines all housing types, price ranges, and home sizes into a single market snapshot. When you drill down into specific segments, the story can look very different. The luxury market, for example, has continued to outperform the broader market, as illustrated below.
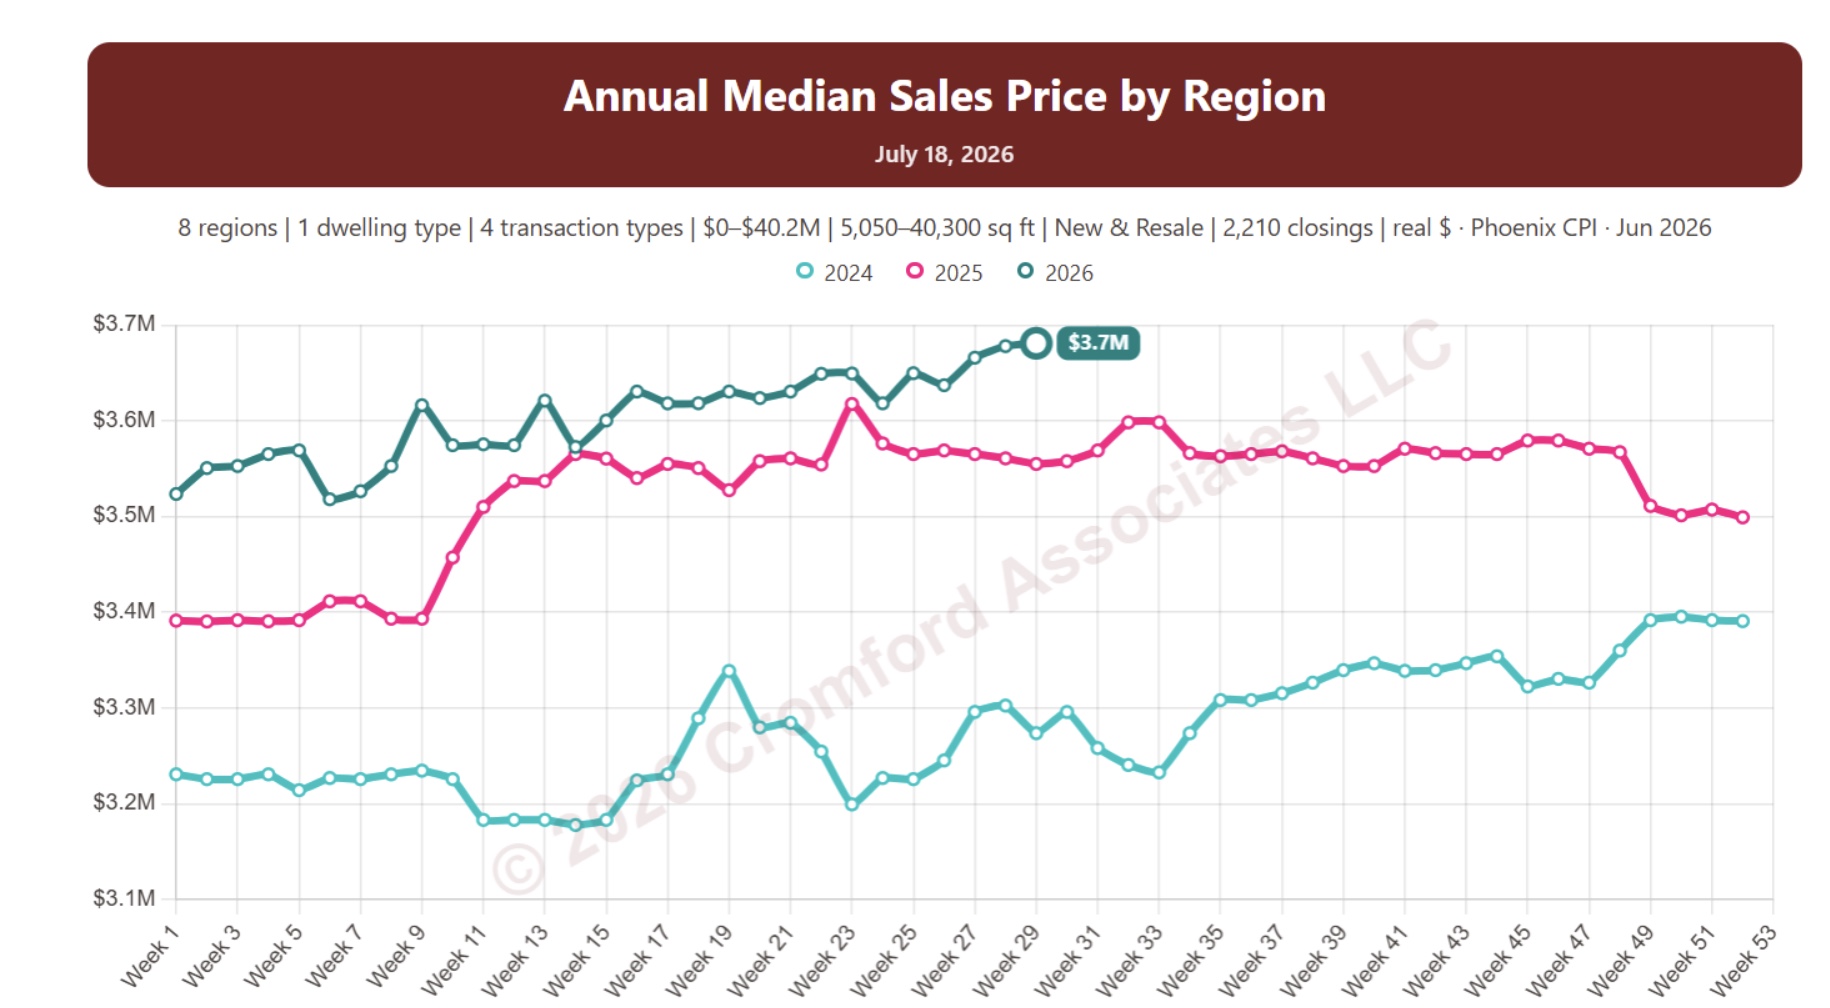
The luxury market tells a very different story. Single-family homes over 5,000 square feet have continued to outperform the broader market. Even after adjusting for inflation, the median sales price has increased from approximately $3.2 million at the beginning of 2024 to about $3.7 million today, demonstrating the resilience of Greater Phoenix's luxury housing segment.
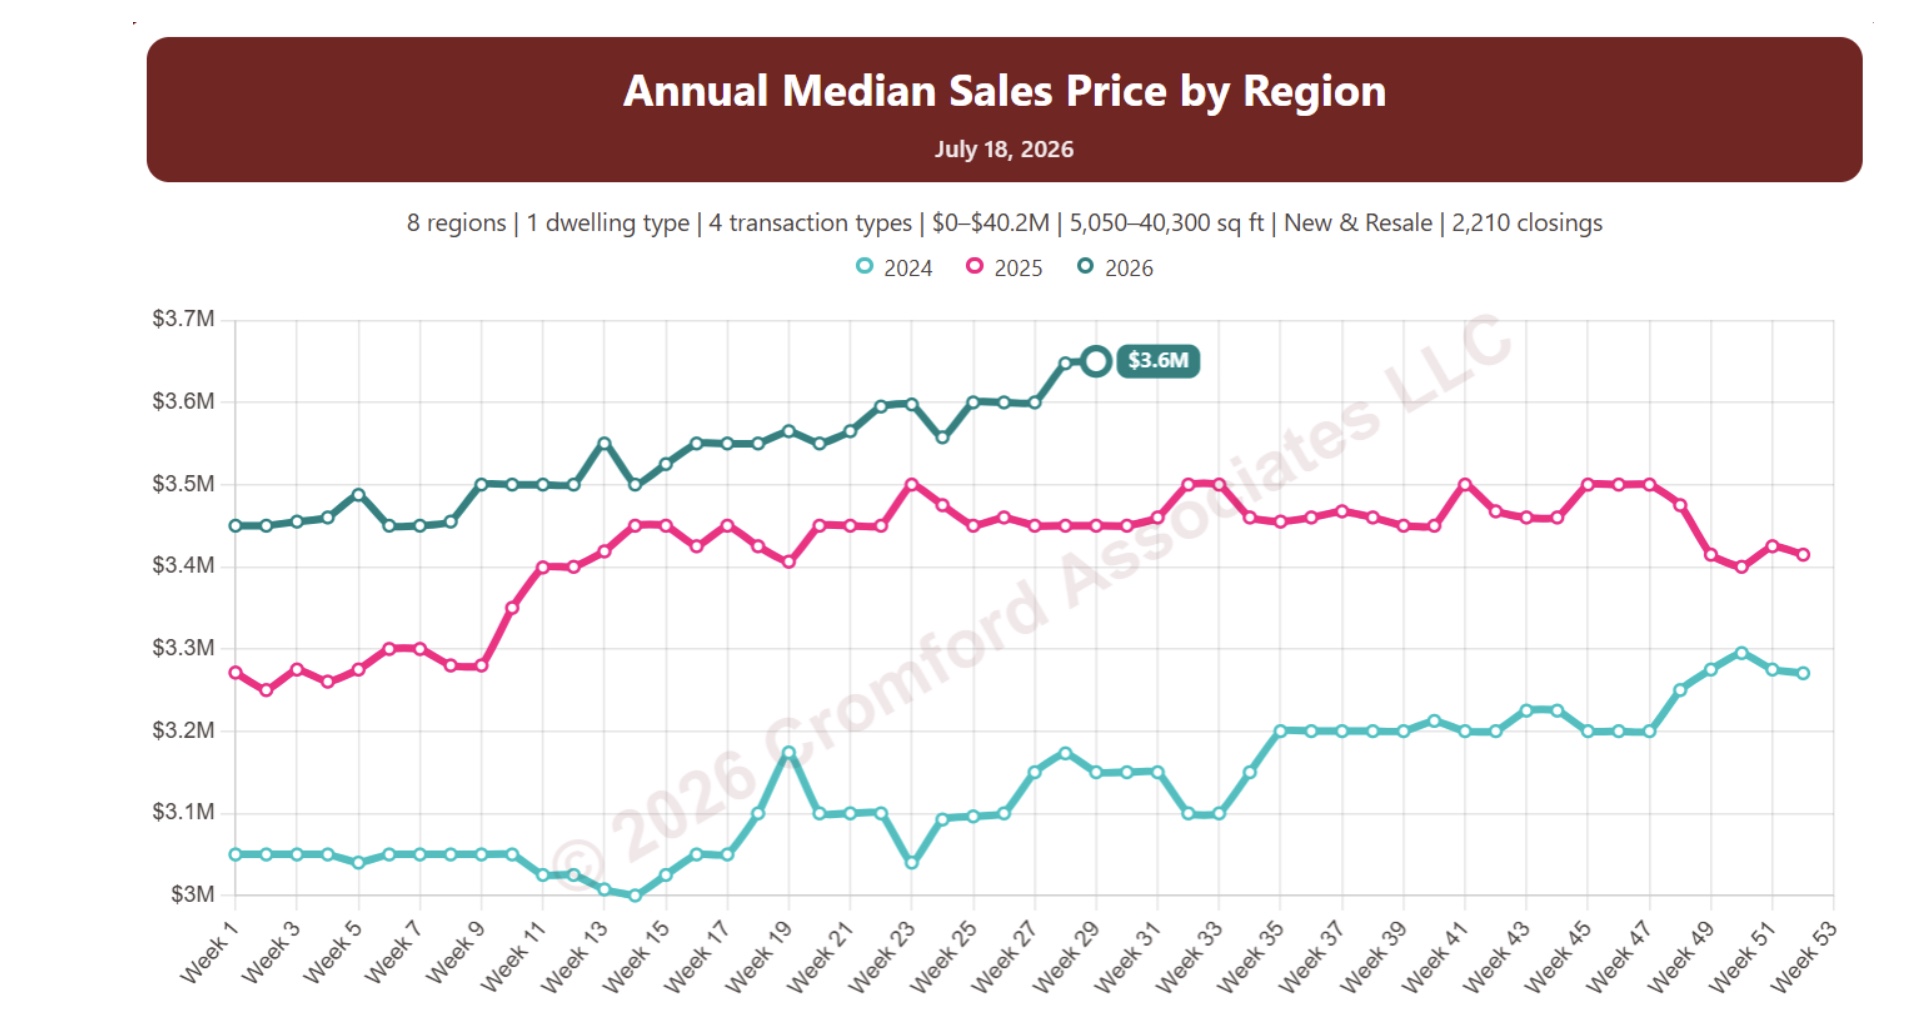
Without adjusting for inflation, nominal prices for these luxury homes have increased approximately 18% since the beginning of 2024—a dramatically different trajectory than smaller, more moderately priced homes.
While most segments of the Greater Phoenix housing market have become more affordable relative to incomes and the rising cost of other goods and services, luxury homes—particularly those in the Northeast Valley—have continued to appreciate at a pace that outstrips inflation.

Mortgage Rates Hit a One-Year High: What's Driving the Surge?
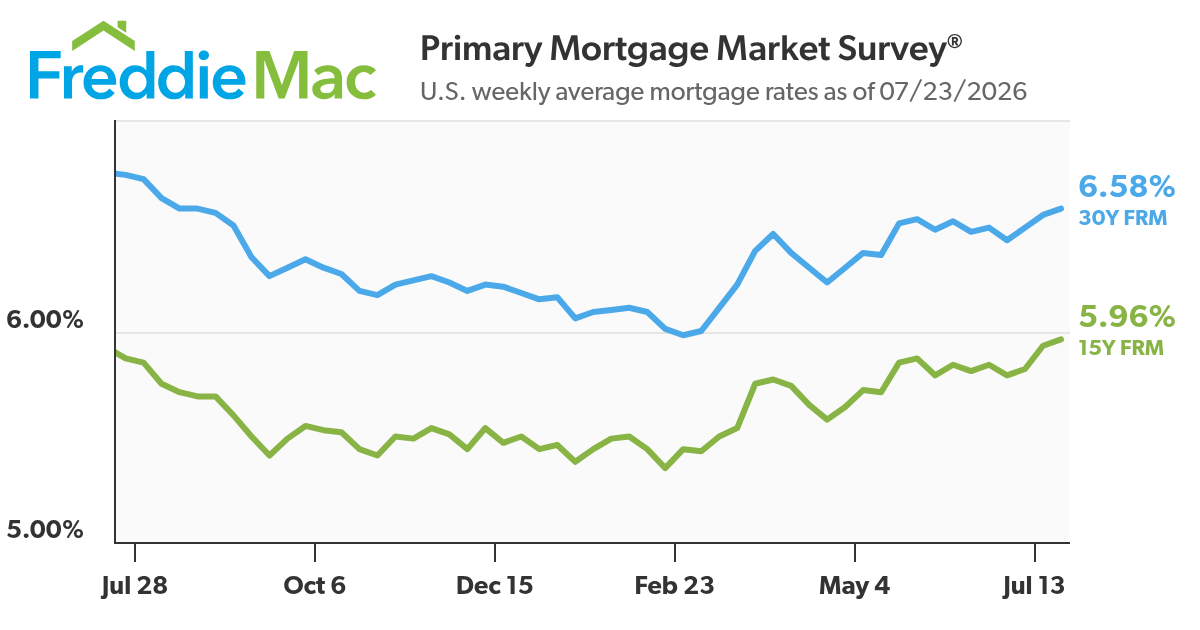
This was a tough week for anyone watching mortgage rates. Geopolitical tensions in the Middle East pushed oil prices near $100 a barrel and bond prices lower, erasing last week's softer inflation optimism. Mortgage rates finished at their highest level in over a year, with the 10-year Treasury breaking through resistance levels it hasn't seen since October 2023. The Federal Reserve meets next Wednesday, July 30, and the stakes feel higher than they have all summer.
Rates, in Plain English
Mortgage rates are priced off long-term bonds, mainly the 10-year Treasury. When bond prices fall, yields rise, and mortgages get more expensive — and that's what happened this week. Last weekend's Houthi attacks on Red Sea shipping added risk premium (extra cost for the danger of disruption) to oil markets, and the Strait of Hormuz story stayed in the headlines all week. By Friday the 10-year had pushed through technical levels that hadn't been touched in over two years, and mortgage-backed securities — the bonds that fund home loans — sold off right behind it. Early-week bond weakness carried into Friday's rally attempt, and rates erased any hope of a summer dip.
Mortgage-Backed Securities
Mortgage-backed securities (commonly called MBS) lower = mortgage rates higher. Here's how the week stacked up:
• Monday 7/20: quiet open, MBS posted a 4 basis-point decline. A basis point is one one-hundredth of a percentage point, so 4 bps = 0.04%. As a feel for what that means to you: on a $400,000 loan, 4 bps is roughly $9 a month in payment.
• Tuesday 7/22: MBS fell and the 10-year climbed. Rates increased roughly an eighth of a point (1/8%) by the end of the session.
• Wednesday 7/23: MBS posted notable losses for the third consecutive day on Middle East headlines and a hot inflation backdrop.
• Thursday 7/24 20-year Treasury auction: institutional demand was soft — a signal that big buyers are getting cautious about long-duration debt (bonds that take a long time to pay back, exposing buyers to more inflation risk).
• Friday 7/24 close: bonds did not recover meaningfully; rates held near yearly highs.
The Federal Reserve
Attention now turns to the Fed's rate-setting committee meeting on Wednesday, July 30. Just a few weeks ago, markets were pricing in near-certainty that the Fed would hold rates steady or signal future cuts. That narrative has flipped. Traders are now actively pricing in the possibility of an actual rate hike at the September meeting — a scenario that seemed unthinkable at the start of the summer. Stronger-than-expected jobless claims this week only added fuel to the inflation hawks' argument. Even if the Fed does hold steady on Wednesday, the Statement and press conference will be parsed for any sign that a September hike is on the table.
Geopolitics
The bond market's mood was set in the Middle East. Houthi attacks on Red Sea shipping pushed oil prices back toward $100 a barrel, and concerns about a confrontation at the Strait of Hormuz (the narrow waterway between Iran and the Arabian Peninsula through which a big share of the world's oil flows) added another layer of risk premium to energy markets. Higher fuel costs feed directly into inflation expectations, which is exactly what bond investors fear. The European Central Bank added to the pressure by openly flagging rate hike risks of its own, which strengthens the dollar and tightens financial conditions globally.
Economic Data
Three data tells shaped the week:
• Retail sales and jobless claims: Mixed retail-sales data and a stronger-than-expected jobless-claims reading got the week off on the wrong foot for bond bulls.
• 20-year Treasury auction (Thursday 7/24): Soft demand from institutional buyers — a signal that the bond market is bracing for higher inflation or higher rates ahead.
• New home sales: Friday's reading was a key catalyst mentioned all week, though post 2 specifically flagged it as an upcoming release.
What This Means for You
If you're in the middle of a purchase or refinance, this week showed the cost of waiting. Even modest upward movement in mortgage rates can translate into hundreds of dollars per month on a typical loan. The lock-vs-float question now matters more than picking the "best" day. Locking means committing to today's rate with your lender so your payment doesn't move; floating means waiting to see if rates improve, with the risk they worsen.
• Buyers close in 7–15 days: lock now. The risk of further increases after Wednesday's Fed meeting is real, and the upside from here is much smaller than the downside.
• Buyers with 30+ days: you have room to float, but set a hard ceiling — pick the rate you cannot afford to exceed, and lock the moment you reach it.
• Sellers: a stable rate window is your friend for showings and offers. This week's tape shows how quickly that window can close.
What We're Watching Next Week
• Wednesday, July 30: Federal Reserve rate decision + Statement + press conference. Even a "hold" will move markets on the wording.
• Friday: New home sales report (delayed reaction in mortgage pricing).
• Ongoing: oil prices and Middle East headlines — the single biggest risk to the bond market right now.
• September Fed meeting: if the July 30 tone turns hawkish (tilted toward fighting inflation, even at the cost of slower growth), the September meeting becomes a live event on the calendar.
Quick Numbers From the Week
• 10-year Treasury: broke above technical resistance levels not seen since October 2023.
• Mortgage-backed securities: down 4 basis points Monday, losses extending through the week; 20-year Treasury auction showed soft demand.
• Mortgage rates: closed at their highest point in over a year, roughly 1/8 percentage point higher than the prior week.
• Oil prices: pushed back toward $100/barrel on Red Sea / Strait of Hormuz / Houthi-attack headlines.
• Fed: rate-setting committee meeting Wednesday, July 30. September rate hike is now a real possibility — not just a tail risk (a worst-case scenario that seemed unlikely).

Market in a Minute
Housing
Greater Phoenix home prices remain steady, with the median sales price holding near record highs. After adjusting for inflation, however, most homes are slightly more affordable than they were at the beginning of 2024.
Luxury homes continue to outperform the rest of the market. Single-family homes over 5,000 square feet have appreciated approximately 18% since early 2024, with the strongest gains concentrated in the Northeast Valley.
Real estate remains a neighborhood-by-neighborhood market. While many entry-level and mid-range homes have leveled off, high-end properties continue to see strong demand, reinforcing the importance of understanding local market trends when buying or selling.
Economy:
Mortgage rates climbed to their highest level in more than a year as rising geopolitical tensions, higher oil prices, and bond market weakness pushed borrowing costs higher.
All eyes are on this week's Federal Reserve meeting. While rates are expected to remain unchanged, investors will be watching closely for any signals that a September rate hike could be back on the table.
Global events continue to influence the U.S. economy. Concerns over Middle East tensions and oil prices approaching $100 per barrel have renewed inflation worries, creating additional pressure on interest rates and financial markets.
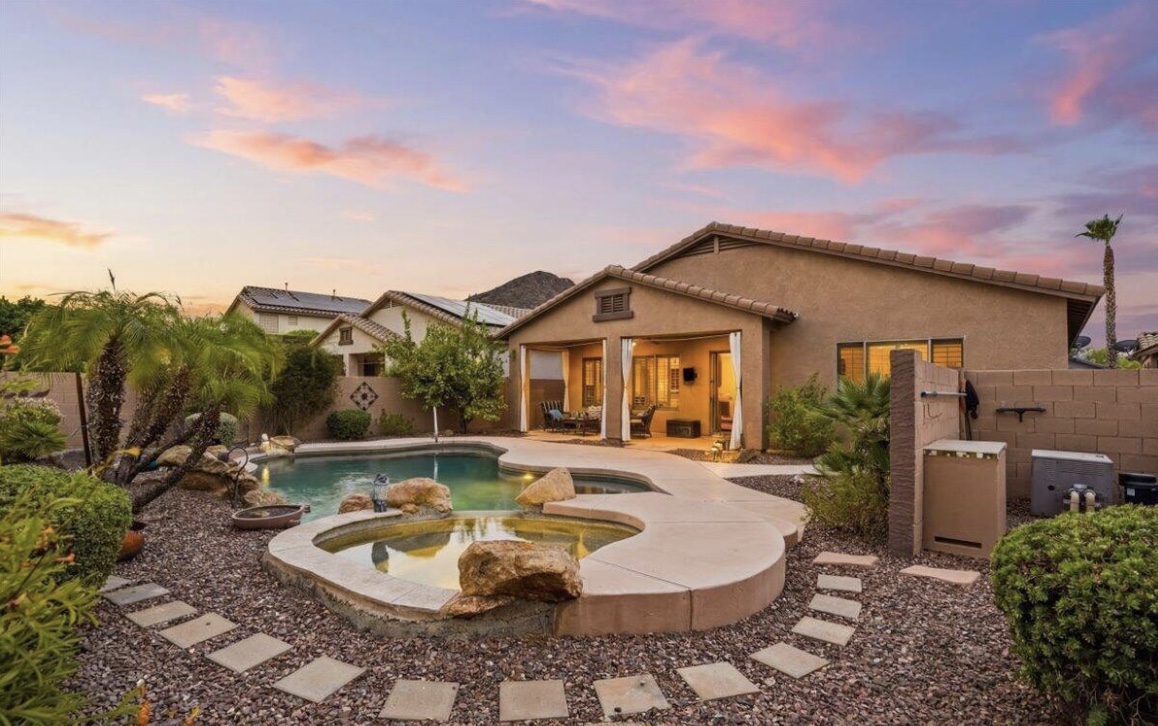
Check Out Our Listings

Thank you to the following preferred Business Partners.
We appreciate your continued support!

PROGRESS LENDING
Kevin Kelly
NMLS# 2326329 MB-1036486
President/Loan Originator
Direct: 602-910-0022
E-fax: 602-288-1156
NMLS# 245238 / AZ LO License #0912711
471 W. Flamingo Drive
Chandler, AZ 85286

GOOSEHEAD
INSURANCE
Naeem Broxton
Account Executive
Licensed in AZ, TX, CA
623-387-8319 (Cell)
800-474-1377 (Service)
Naeem.Broxton@goosehead.com

NEW LIFE PAINTING
Filberto Lopez Hernandez
Owner
602-748-6670 (Direct)


Comments