
Monday Morning Real Estate Mojo

August 17, 2026
Edition #202
Mojo defined
1. A term used for self-confidence, self-assuredness.
2. The basis for belief in ones self in a situation.
3. Efficacy to bolster confidence.
4. Ability to bounce back.
There has been so much misinformation about the real estate market in the national media lately...our goal is always to provide our clients with accurate, real time market data.
Phoenix Market Gains—But There’s More to the Story

The average Cromford Market Index (CMI)* is up 2.1% from last month, a slight improvement from last week’s 1.8% increase. While that sounds encouraging for sellers, much of the gain is being driven by the luxury market—particularly Paradise Valley.
Paradise Valley’s unusually strong CMI is largely the result of a significant drop in available inventory. Nearly half of the listings that were on the market in May have disappeared. Over the past three months, 98 listings have been canceled and another 27 have expired, compared with just 94 closed sales. Fountain Hills, Scottsdale, and Cave Creek have also improved, although to a lesser degree, as summer inventory has contracted.
Outside of the higher-end markets, buyer demand remains relatively weak, although conditions in the Southeast Valley have begun to stabilize.
This week, 10 cities are moving in a direction favorable to sellers, up two from last week, while 8 are moving in a direction favorable to buyers. The strongest movement toward buyers is occurring in Buckeye, Peoria, Glendale, and Tempe.
Overall, the Valley remains a highly segmented market. Of the 18 cities tracked, 8 are currently seller’s markets, 4 are balanced, and 6 are buyer’s markets. The takeaway continues to be that market conditions can vary significantly depending on location and price point.
*Cromford Market Index™ (CMI) is a value that provides a short term forecast for the balance of the market. It is derived from the trends in pending, active and sold listings compared with historical data over the previous four years. Values below 100 indicate a buyer's market, while values above 100 indicate a seller's market. A value of 100 indicates a balanced market.
Real Dollars: The Numbers That Actually Matter
We studied the weak period in the housing market that has lasted since the froth of the COVID frenzy blew away. Using the most recent price peak as the baseline means almost all methods of measuring home prices show a gloomy picture because, by definition, we started at the top of the market, which, for the vast majority of segments, was in the second quarter of 2022. Gloom should really be confined to home sellers, however, because from a home buyer’s perspective, their target homes have become far more affordable. Median incomes have grown substantially since mid-2022, and home prices have mostly gone down or stabilized. This is especially true in the lower tiers of the market. Only at the luxury end of the market have we seen substantial rises in home prices since mid 2022 in Greater Phoenix.
The buyers who purchased in the first half of 2022 are the ones who suffered the worst effects of this recent price trend. If you remember this 6-month period, the majority of buyers during those crazy months were iBuyers and institutional investors. Normal buyers could barely get a look-in as each home got dozens of offers. Let us now look at price movements over 2 longer periods – 10 years from 2016 to 2026 (August in both cases) and 7 years from 2019 to 2026 (also August to August). The start dates were times when the market was positive but not frenzied, so this analysis should result in a more realistic vision of what has happened to home prices over 2 longer terms.
This process has underscored a couple of principles that we have acknowledged for some time.
Using price bands as a segmentation device is popular, but less than ideal because, over a long period, a large number of houses migrate from one band to another.
A better segmentation device is home size. Bigger homes tend to be more expensive than smaller ones, but homes do not tend to drift from one size band to another. The primary exception is when a small and old property is demolished to make way for a far grander replacement. This type of action is concentrated in Paradise Valley and Arcadia, where 16% to 18% of transactions involve a scrape and new build. An analysis of these 2 areas shows that it has a distorting effect on all price measurements. However, the median price per square foot is affected the least of all and remains largely undistorted. And in the rest of Greater Phoenix, fewer than 1.3% of transactions involve a complete rebuild.
So let us continue by using home size instead of price range as the segmentation. We will focus on single-family detached homes. Other types of homes have lost market share over this period, so including them would distort the picture a little more than we like.

Over ten years, we can confirm a very substantial increase in nominal median price per square foot since August 2016, with much of that happening after August 2019. We have already seen that most of the increase took place between 2020 and 2022. Nevertheless, in nominal terms, most homes more than doubled in price over the last 10 years.
We also notice several other things:
Homes over 6,000 square feet but below 10,001 won the competition easily over both periods.
Homes between 4,001 and 6,000 square feet came second over both periods.
Smaller homes of 1,500 square feet and under did well in the first 3 years but much less well from 2019 onwards.
The most common size of all, 1501 to 2,000 square feet, underperformed the rest of the market.
Homes over 10,000 square feet have appreciated substantially less than the range below them.
Before we get too excited, let us look instead at real $/SF, the above numbers adjusted for inflation by applying the Consumer Price Index and expressing all dollars in their June 2026 value.
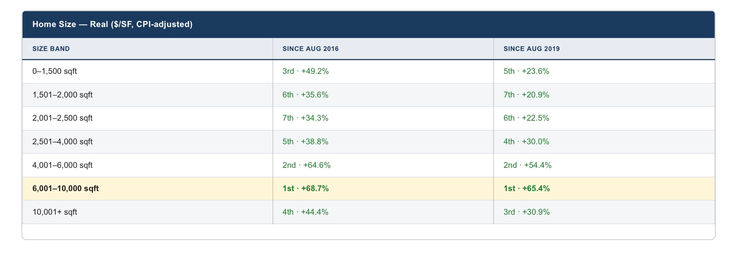
These are all positive numbers, so over the longer-term 7-year and 10-year views, we have clear evidence of substantial appreciation even after inflation. The size bands are also closer together in that appreciation, though the 6,001 to 10,000 range is still first, with 4,001 to 6,000 in second place. It also suggests that going for a home over 10,000 sq. ft. might not be quite as rewarding an investment as one below 10,000 sq. ft.
Finally, let us re-examine the August 2022 to August 2026 period using home size instead. Adjusting for inflation, home prices have moved downwards except for homes between 4,001 and 10,000 square feet.

Starter homes, those under 2,000 square feet, have become substantially cheaper relative to inflation, down 16% to 17%. As you move upwards in home size, the picture improves until you reach 10,000 sq. ft. At the top end, over 10,000 sq. ft. homes begin to lose ground again, though this looks a lot less obvious when you convert to nominal dollars.
For completeness, here is the equivalent table in nominal dollars per square foot:


Good News for Buyers: Mortgage Rates Finally Move Lower
This was one of those weeks where the market told two very different stories in the span of five days — and the ending is the part worth paying attention to. Let's walk through what happened, where rates sit today, and what it means for buyers, sellers, and anyone thinking about a refinance.
What moved rates this week
We started the week on the back foot. Coming out of the Fed's late-July meeting, the central bank held rates steady but struck a distinctly cautious tone on inflation. The 30-year Treasury yield actually pushed to its highest level since 2007, and Fed Chair Kevin Warsh signaled he's prepared to raise rates if inflation readings run hot in the weeks ahead. That got the bond market's attention fast — by midweek, traders were pricing in better-than-even odds of a rate hike at the September meeting.
Then oil jumped in. Renewed tensions around the Strait of Hormuz sent crude prices higher, and since energy costs feed directly into inflation expectations, Treasury yields climbed right alongside them. By Thursday, the 10-year Treasury — the benchmark that mortgage rates track most closely — was hovering near 4.68%, right at the top of its recent range. Mortgage rates followed, with the 30-year fixed averaging around 6.69% mid-week, its highest reading in more than a year.
And then Friday flipped the script. The July jobs report landed and it was a genuine surprise: instead of the roughly +80,000 jobs economists expected, the economy actually lost 23,000 jobs. Wage growth cooled to 3.2% year-over-year — the slowest pace since May 2021 — and while the unemployment rate ticked to 4.1%, that was mostly because fewer people were in the workforce. In plain English: the labor market looks softer than anyone thought, which cools the case for the Fed hiking in September.
Bond markets reacted immediately. The 10-year Treasury eased back toward 4.65%, the 2-year dropped to around 4.20%, and by Saturday morning the 30-year fixed had slipped about five basis points to roughly 6.54%. The September hike odds that had everyone nervous on Wednesday? Largely gone by Friday afternoon.
Where rates stand right now
As of week end, the 30-year fixed is sitting in the mid-6% range (roughly 6.54%–6.69% depending on the day and the borrower profile), with the 10-year Treasury near 4.65%. The takeaway: rates spent most of the week climbing on inflation and Fed worries, then got pulled back down by a weak jobs number. We're ending the week lower than we were mid-week — a welcome reversal.

Rates are illustrative, move daily, and vary by credit, loan type, and property. Your exact number depends on your full profile.
What it means for you
If you're buying — this week is a good reminder of why timing the market to the day is a losing game. Rates swung meaningfully in both directions inside of a single week based on news no one could predict. The smarter play is getting fully pre-approved so you're ready to move when the right home and a good rate line up.
If you're on the fence — a softening labor market and cooling wage growth are exactly the conditions that tend to ease rates over time. I'm not going to promise where things go from here (nobody honestly can), but the Friday reversal shows the door can open quickly. If you've been waiting, let's at least run your numbers now so you're positioned to act rather than scramble.
If you're thinking about refinancing — if you closed when rates were higher, keep this week on your radar. Even a partial pullback can change the math on a refi, a cash-out for renovations or debt consolidation, or tapping a HELOC. It's worth a five-minute conversation to see whether the current dip works in your favor.
For my investor clients — with the labor picture softening, keep an eye on how it filters into local rents and cap rates. DSCR and bank-statement options remain a strong fit for scaling a portfolio without the W-2 paperwork drag. If you're eyeing a purchase this quarter, let's map out the financing before you write the offer.
The bottom line
Rates climbed on Fed and inflation jitters, then the jobs report cooled things off and pulled them back down to close the week. It's a healthy reminder that the market can turn on a single data point — which is exactly why being ready beats trying to be lucky. Whether you're buying, refinancing, or investing, let's get your numbers dialed in so you can move the moment it makes sense for you.
Always happy to talk it through — reach out anytime.

Market in a Minute
Housing
CMI Improves: The average Cromford Market Index is up 2.1% from last month, with Paradise Valley driving much of the improvement.
More Markets Favor Sellers: 10 cities are trending toward sellers, while 8 are moving toward buyers. The Valley remains split with 8 seller’s markets, 4 balanced, and 6 buyer’s markets.
Demand Still Soft: Buyer demand remains relatively weak across much of Greater Phoenix, although the Southeast Valley is showing signs of stabilization.
Economy:
Rates Finally Ease: Mortgage rates moved lower for the first time in six weeks, providing a little relief for buyers.
Labor Market Cools: A weaker-than-expected July jobs report and slower wage growth added to signs that the economy is cooling.
Inflation Behaves: CPI came in in line with expectations, helping calm the bond market and easing some concerns about additional Fed tightening.

Check Out Our Listings


Thank you to the following preferred Business Partners.
We appreciate your continued support!

PROGRESS LENDING
Kevin Kelly
NMLS# 2326329 MB-1036486
President/Loan Originator
Direct: 602-910-0022
E-fax: 602-288-1156
NMLS# 245238 / AZ LO License #0912711
471 W. Flamingo Drive
Chandler, AZ 85286

GOOSEHEAD
INSURANCE
Naeem Broxton
Account Executive
Licensed in AZ, TX, CA
623-387-8319 (Cell)
800-474-1377 (Service)
Naeem.Broxton@goosehead.com

NEW LIFE PAINTING
Filberto Lopez Hernandez
Owner
602-748-6670 (Direct)


Comments